

To calculate Average Order Value (AOV), divide total revenue by the total number of orders within a specific reporting period. This straightforward AOV formula is the foundation of average order value calculation, helping restaurant brands understand their exact revenue per transaction and overall spend per customer across different digital touchpoints. By learning how to calculate aov, a multi-location franchise can easily evaluate the performance of each sales channel, comparing the transaction value of kiosk orders against mobile ordering to see which platforms drive the highest order value.
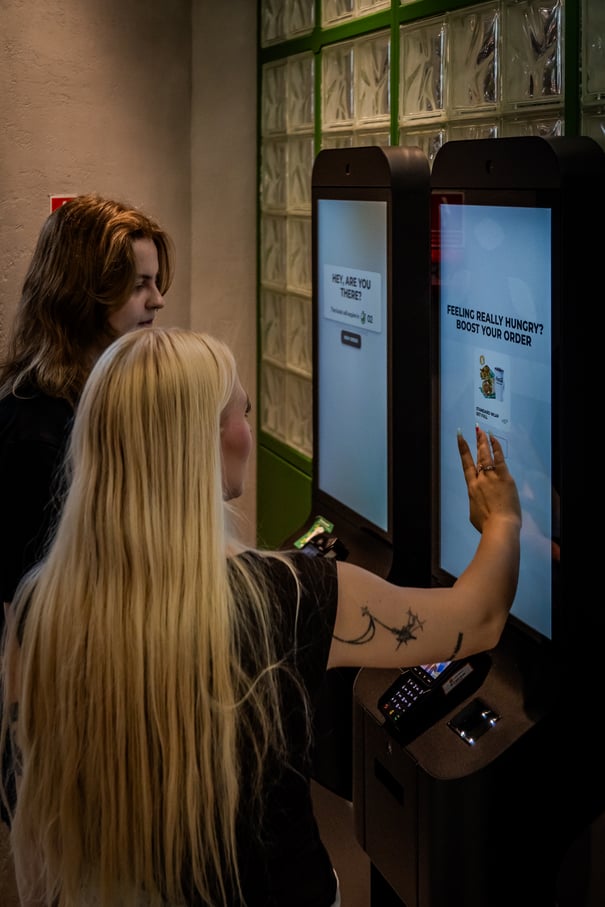
However, choosing the right average order value calculation methods requires robust data integration to get a true picture of your business health. For accurate franchise reporting, operators must determine whether to use gross revenue or net revenue by subtracting refunds from the equation, and then seamlessly combine this with in-store POS data. Leveraging real-time analytics allows large restaurant chains to monitor shifts in order value and order frequency instantly, turning basic transactional metrics into actionable insights to optimize upselling and menu engineering.
What you will learn from this article:
- The basic AOV formula and how to apply it step by step.
- Different methods of calculating AOV depending on sales channel (kiosk, mobile, in-store).
- Common mistakes that distort AOV calculations.
- How to calculate AOV for multi-unit restaurant chains and franchises.
- How Ordering Stack automates AOV calculation across all ordering channels.
The Basic AOV Formula
At its core, the standard AOV formula is incredibly straightforward. To find your average transaction value, you simply divide the overall revenue generated by the total number of transactions processed over a specific timeframe.
To see how this works in practice, let us walk through a simple step-by-step calculation for a typical multi-location franchise during a monthly reporting period.
Step 1: Identify your total revenue. Suppose your brand analyzes its sales channel data and determines that the gross revenue across all locations is $155,000. After deducting $5,000 in refunds, your net revenue for the month is $150,000.
Step 2: Collect the total number of orders. By consolidating POS data, kiosk orders, and mobile ordering transactions, your system reports a total of 10,000 completed orders.
Step 3: Apply the average order value calculation. Using the formula, divide your net revenue of $150,000 by the 10,000 orders.
$150,000 / 10,000 = $15
In this example, your average order value is $15. This means that, on average, every customer interaction across your digital and physical touchpoints yields a revenue per transaction of fifteen dollars. Knowing how to calculate AOV using this basic method gives you a clear benchmark to measure future growth and the success of your upselling strategies.
Average Order Value Calculation Methods by Channel
Relying on a single metric for your entire multi-location franchise can obscure important consumer behaviors. Different digital and physical touchpoints have entirely different cost structures, pricing models, and upselling mechanics. To gain a truly accurate picture of your business, operators must apply specific average order value calculation methods tailored to each sales channel. Through proper data integration, you can separate total revenue and the number of orders by their origin, allowing for precise franchise reporting and real-time analytics.
|
Sales Channel |
Data Source |
Calculation Specifics |
|
Kiosk orders |
In-store digital displays |
Focuses heavily on automated upselling prompts. Total revenue must strictly exclude abandoned carts or timed-out sessions before payment. |
|
Mobile app orders |
Native mobile ordering platforms |
Influenced by digital loyalty programs. Calculate revenue per transaction by using net revenue after promotional discounts are applied. |
|
Dine-in POS orders |
Traditional front-of-house POS data |
Gross revenue often includes gratuities or service charges which must be subtracted to reveal the true food and beverage transaction value. |
|
Delivery aggregator orders |
Third-party marketplace integrations |
Requires deducting high commission percentages, driver fees, and platform-issued refunds to determine the actual restaurant revenue per transaction. |
For kiosk orders, self-service screens naturally drive higher ticket sizes due to consistent, algorithmic upselling. When calculating the AOV for this channel, ensure your reporting period clearly isolates kiosk terminals from standard registers. The calculation should only use completed transactions, meaning your system must filter out instances where guests began an order but did not complete the payment process.
Mobile ordering presents a different challenge because it is often tied tightly to loyalty programs and digital coupons. Your average order value calculation methods here must account for these discounts. To find the true transaction value, you must base your AOV formula on the net revenue generated after loyalty rewards and promo codes are redeemed, ensuring that added service fees or driver tips do not artificially inflate the core menu order value.
When dealing with dine-in POS orders, traditional POS data processed by cashiers or waitstaff frequently includes manual gratuities. For accurate franchise reporting, these tips must be meticulously stripped from the gross revenue before doing any math. This adjustment guarantees that your revenue per transaction reflects only the actual items purchased by the guest, providing a clean baseline for menu performance and order frequency analysis.
Finally, delivery and aggregator orders involve complex external variables. Third-party platforms take high commission rates, charge customer delivery fees, and frequently process refunds for missing items directly through their app. Relying on gross revenue here will create a highly distorted picture. Advanced data integration is required to automatically subtract marketplace commissions, courier fees, and any third-party refunds, ensuring your final average order value calculation represents the actual money reaching your multi-location franchise.
How to Calculate AOV for Multi-Location Franchises?
For a multi-location franchise, applying the AOV formula on a network-wide scale provides a broad overview of overall brand health. However, simply aggregating total revenue and the total number of orders across dozens of sites can easily hide underperforming stores. To gain true operational visibility, operators must also utilize average order value calculation methods at the individual location level. This granular approach allows regional managers to pinpoint exactly which restaurants are maximizing their revenue per transaction and which ones might be struggling with their local upselling tactics.
Crucially, comparing the transaction value between different branches is only useful if your franchise reporting is built on perfectly normalized data. If one location includes taxes in its gross revenue while another calculates AOV based strictly on net revenue, the resulting metrics will be heavily skewed. This is why seamless data integration across all touchpoints is vital. By unifying in-store POS data and self-service kiosk orders into a centralized Ordering Stack system, operators can leverage real-time analytics to ensure every average order value calculation is standardized, accurate, and fully comparable across the entire enterprise.
Common Mistakes When Calculating AOV
Even though the math behind the average order value calculation is simple, mistakes in data preparation often lead to skewed insights for a multi-location franchise. Without clean data integration, brands run the risk of basing critical business decisions on flawed metrics. Here are the most frequent pitfalls operators encounter when performing an average order value calculation:
- Including refunds and canceled transactions in your total revenue. When applying the AOV formula, relying blindly on gross revenue instead of net revenue will artificially inflate your transaction value. If a customer places a large mobile ordering request but cancels it later, or if a kitchen error results in processing refunds, these figures must be completely subtracted from your data to avoid a false representation of customer spend.
- Mixing different reporting periods. For accurate franchise reporting and real-time analytics, both the total revenue and the total number of orders must originate from the exact same timeframe. Pulling sales revenue from one specific month while inadvertently including order counts from overlapping weeks entirely ruins the validity of how to calculate aov.
- Failing to implement proper sales channel segmentation. Grouping all transaction types together means you lose visibility into how customer behavior changes between on-premise guests and digital users. Without separating POS data from kiosk orders and delivery apps, you cannot see which platforms provide the highest revenue per transaction or notice shifts in order frequency.
- Blending taxes, delivery fees, and service charges directly into your core revenue calculation. Including these operational extras in your total revenue creates an illusion of a higher average order value. To understand the true product transaction value, these external costs must be filtered out so that you are only measuring what the guest actually spent on your menu items.
How to Automate AOV Calculation with Ordering Stack?
Manually tracking total revenue and the number of orders across every single sales channel is a tedious process that leaves room for critical errors. Ordering Stack eliminates this manual workload by offering seamless data integration across your entire digital ecosystem. By automatically consolidating in-store POS data, self-service kiosk orders, and mobile ordering transactions into a single unified dashboard, the platform instantly applies the correct AOV formula to each specific source. This means your management team no longer has to worry about manually subtracting refunds or struggling to separate net revenue from gross revenue at the end of a reporting period.
With Ordering Stack, multi-location franchise operators gain immediate access to real-time analytics and comprehensive franchise reporting. You can effortlessly monitor your order value and order frequency side-by-side, allowing you to instantly identify which locations or platforms are driving the highest revenue per transaction. Instead of spending hours figuring out how to calculate AOV using messy spreadsheets, you can focus on actionable strategies to increase guest spending. Ready to see how centralized data can transform your restaurant chain? Contact us today to schedule a demo and discover how Ordering Stack can streamline your average order value calculation methods.
Conclusion
Mastering the average order value calculation is an essential step toward maximizing profitability and truly understanding guest behavior. Whether you operate a growing regional brand or manage a massive multi-location franchise, knowing your exact revenue per transaction gives you the baseline needed to optimize menu engineering, refine upselling tactics, and evaluate the performance of every sales channel. By applying the correct AOV formula and tailoring your approach to account for the unique traits of POS data, kiosk orders, and mobile ordering, you ensure that your financial insights are always grounded in reality.
Ultimately, the accuracy of your transaction value depends entirely on the quality of your data. Avoiding common pitfalls, such as ignoring refunds or blending taxes into your total revenue, is crucial for maintaining clear visibility into your brand performance. By leveraging advanced data integration tools like Ordering Stack, you can fully automate your real-time analytics and franchise reporting. This removes the guesswork from how to calculate AOV, providing you with precise, actionable data to confidently drive your restaurant business forward.
FAQ
Is AOV calculated before or after tax?
To get a true understanding of customer spending habits, AOV should always be calculated before tax. Taxes, such as VAT or local sales tax, are simply collected on behalf of the government and do not reflect the actual value of the food or services your customers choose to purchase. Including tax in your calculations will artificially inflate your transaction value and lead to inaccurate reports. Therefore, always use net sales, which exclude taxes and service fees, as your total revenue when using the AOV formula.
Should refunds be included in the AOV calculation?
Refunds and canceled transactions should be excluded from your AOV calculations. If you base your average order value calculation methods on gross revenue that includes refunded items, your data will be skewed. To ensure your franchise reporting is accurate, subtract all refunds and cancellations from your total sales to find your net revenue before dividing by the number of orders. Utilizing automated POS data and real-time analytics makes it easy to filter these anomalies out automatically.
How often should restaurants recalculate AOV?
The ideal frequency depends on your operational goals. For high-level strategy and franchise reporting, calculating AOV on a monthly basis is standard practice. However, many multi-location franchise brands choose to monitor these numbers weekly or even daily using real-time analytics. This allows operators to immediately see the impact of a new mobile ordering campaign, seasonal menu promotions, or changes to the user interface of their kiosk orders.
What's the difference between AOV and average check size calculation?
While these two terms are often used interchangeably, they have a subtle but important distinction. Average order value measures the revenue per transaction, meaning how much money is spent every time an order is processed. This applies whether a single person buys lunch at a self-service terminal or a family places a massive delivery order online.
On the other hand, average check size calculation, particularly in table-service environments using traditional POS data, can refer to the spend per cover or per guest. For instance, a single table order represented by one transaction might have a very high average order value, but when divided by the four guests sitting at that table, the average check size per person is much lower. Understanding both metrics helps brands optimize both their general transaction value and overall order frequency.